Lecture
Content
1. Connecting to a remote server through the terminal
2. Errors causing Apache Mysql Nginx PostFix Proftd to fail
2.1. there is no connection with anything, for example with a terminal, with http
2.2. there is a connection with ssh on port 20, but the rest of the ports do not work.
2.3. remote restart of the computer through the terminal
2.4 Solution of the problem "/var/run/mysqld/mysqld.sock not found"
2.5 Failed to start mysql.service: Unit mysql.service is masked.
2.5 out of memory and free check
3. Starting and rebooting daemons, processes, computer from the Ubunutu terminal
3.1 start, stop and restart processes
3.2 normal process start
3.3 Running in the background of the process, unlinked from the terminal in Ubuntu,
4. Work with file system
4.1. what are the system physical partitions, disks
4.2 folder creation
4.3 mounting devices
4.4 permanent auto mount
4.5. unmounting
6.Adjust the system
7. Automating the top devices
5. Work with users
6. CONFIGURING DEMONS AND PROCESSES, setting time
6.1 general questions
6.2 apache config
6.3 config nzhina
6.4 user config php.ini
7.install and update the program in ubunutu
8. free antivirus in ubunutu
9. load monitoring
9.1 server load report is calculated via the system command
9.2 use of the network interface
9.3 memory usage report
9.4 report from server ping from another server
9.5 report on Apache logs, for cov requests, response codes, transmitted byte count
9.6 viewing system loads in real time
10. creating backups and monitoring their execution
11. security monitoring
12. General information about the system
13. Viewing the iron configuration
LAMP is an acronym for server software suite (complex), widely used on the World Wide Web. L
. LAMP is named after the first letters of its components:
Suppose you have already configured a server and need its daily support. and disaster recovery.
For remote access from the Windows environment, a special program is needed, the so-called. SSH client.
An example of such a program is putty, which can be downloaded from the official website http://www.putty.org/.
At the beginning you will need to know the ip of the remote server and the port number on which everything should be pre-installed including the SSH server.
Also, you need a previously created user with the specified login and password for remote access and having root login permissions.
So let's get started:
If you connect through a remote client, then start it, configure the connection.
If the terminal closes the connection when idle, then set the transfer of an empty command every half minute.
If Cyrillic is displayed incorrectly, change the settings to UTF8 or download a newer client with its built-in support and configured for UTF8 initially.
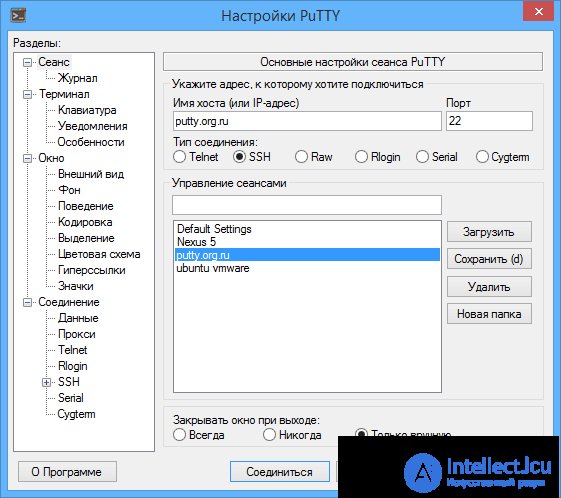
If there is no connection, then you need to check the port, ip, whether there is a space or Cyrillic in the login password, did not block or did not delete
user does not block your anti-virus browsermauer, router to the appropriate port and ip address.
for example telnet utility.
If you log in locally from a computer, it is enough to start the terminal by simultaneously pressing the key combination Ctrl + Alt + T
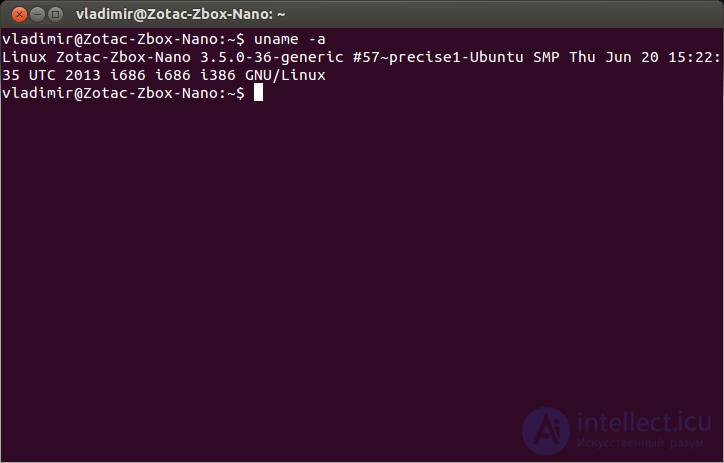
Enter your login
password (when you enter the password, nothing is displayed or the cursor is not a single asterisk)
If the login is successful, then receive a greeting from the operating system.
In order to execute commands from root, you need to start the sudo process
log in as root sudo su
and confirm password
exit the root exit once
clear terminal screen - clear
To work with the file system significantly simplifies and speeds up work with it.
Convenient file manager with pseudo-graphic interface Midnight Commander:
To run, type mc
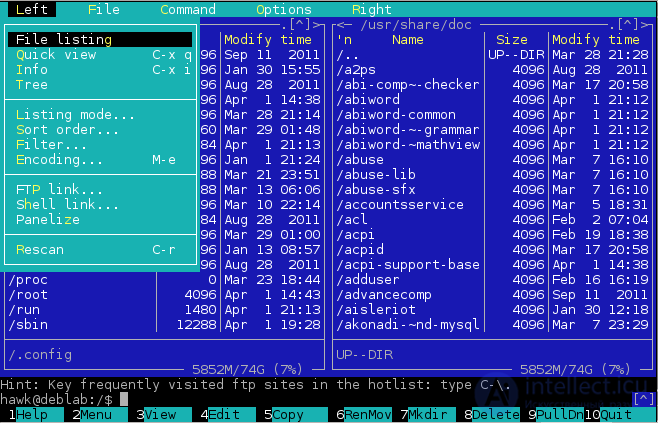
To copy, you just need to select the necessary and it will already be all in the buffer.
To insert you need to press the right mouse button,
To view the history of the execution of commands or results, click the up arrow at the bottom right
scrolling top of the runner on the right - the text of the output terminal after the execution of commands
To solve this problem, you need to see if there is any payment arrears; in the case of a leased server, write or call
they can either help them or solve the problem themselves, may not start the server, either they have errors on the hard drive, or try to get access to the router and see if it has redirected ports to the correct type, if it is on, if the Internet is in the room where the server is installed do not bother to restart the router.
To solve such problems, after connecting through the terminal, you need to look at all the necessary logs and try to start unmounted daemons and processes with repeated log viewing
__________________________________________________________________________________
Often the cause of errors can be found in the logs, almost all programs log errors in the system file and their folders located in / var / log.
Now consider the typical errors that may occur in the server software.
MySQL error of type got 20 : check whether there is enough free space on hard drives (should be more than 5%) if not, then clean unnecessary backups / var / www / backup / *, folder / tmp
Error is busy port - apparently another one or the same application is running and it is listening on this port.
check with netstat -tpln
MySQL error does not have a socket file ... try to restart the daemon several times first, check the permissions on this socket file, read the logs carefully and if nothing helped, try to create it, but not manually, but with a special utility.
Error starting any service can also be due to lack of space in the / tmp partition or on the entire hard drive.
Apache 2.2 launch error - probably there is no domain in DNS, check if dns-records are paid, if not, then disconnect the domain from the config. Also, the cause of not starting apache may be a syntax error of the configuration file, for testing the syntax
you can run the command: apachectl -t
When working with a MySQL relational database, you may encounter a problem: when starting the daemon (service) mysqld , an error message is returned:
  ERROR 2002 (HY000): Can't connect
 to local MySQL server through
 socket '/var/run/mysqld/mysqld.sock' (2)
The same error in the logs looks like this:
  [ERROR] Can't start server: Bind on unix socket: No such file or directory
 [ERROR] Do you already have a server running on socket: /var/run/mysqld/mysqld.sock?
In other words, the MySQL daemon cannot connect to the Unix-socket. And this can happen for two reasons:
To check the first option, you can try to find out: is there someone who is taking up this file?
sudo lsof /var/run/mysqld/mysqld.sock
As a result, we get something similar:
  COMMAND PID USER FD TYPE DEVICE SIZE / OFF NODE NAME
 mysqld 1299 mysql 6u unix 0xf6546840 0t0 7877 /var/run/mysqld/mysqld.sock
where you can see who borrowed the file. Or
  ...
 lsof: status error on /run/mysqld/mysqld.sock: No such file or directory
 ...
- file is missing.
In the first case, everything is clear - either so, or disable the application that occupied the socket.
In the second case, it is worth creating a socket and / or making it available to mysql, for this we perform:
  sudo mkdir / var / run / mysqld
 sudo mkfifo /var/run/mysqld/mysqld.sock
 sudo chown -R mysql / var / run / mysqld
Line by line:
After that, MySQL should work fine.
  The following has fixed the problem.

 1.rm -r / var / lib / mysql * # delete all database settings (you can try to omit this step. After that, you will lose all databases)
 2. mysql_install_db -u mysql # create a new database
 3.systemctl unmask mysql.service # activates the service for systemd
 4. service mysql start # start the service.


  2.5 out of memory
  check free
  / proc / meminfo
  or
free -m
 free -m | sed -n -e '3p' | grep -Po "\d+$" реальный размер без учта кеша (но наверное неправильно)
 очистка кеша файловой системы в памяти
 разово sync && echo 3 | sudo tee /proc/sys/vm/drop_caches

  in crown * / 15 * * * * root sync && echo 3> / proc / sys / vm / drop_caches
  in config
sudo sysctl -w vm.drop_caches=3 (но это эффекта не даст, т к система бз кешей можт тормозить)
restart apache: service apache2 restart or stop or start
reboot nginx: service nginx restart
reboot ftp server: service proftpd restart
restart mail server service postfix restart
reboot PHP 7.0 if it works in FPM / FastCGI service php7.0-fpm restart mode
do not rush to reboot the database server;
work and the base can be used for its restoration.
it is better to first try to unload all users by stopping apache, and then just restarting the muscle.
restart mysql: service mysql restart
if it doesn't restart by daemon, then you can try the process like so /etc/init.d/apache2 restart
If the access to the database server is present and other users cannot connect to it or slows down, you can see what the database server SHOW PROCESSLIST, KILL 4 will perform at the moment . Complete the process. Run these commands directly in mysql, not in the terminal.
To view a specific query, you can either enable full logging of queries or into a database or a text file, or enable logging of slow-running queries in settings, for example, those executed for more than 5 seconds.
see (unload) what is now running and the load: htop is an analogue of the windows task manager in Linux.
kill id unload process immediately with id
restart the computer immediately- command: reboot
path_to_application parameters [> where to output output]
an example of compiling and installing programs from sources
1. tar -xvf .tar.gz - unzip the archive
2. cd * go to the desired folder
3. ./autogen.sh
4. make
For all file creation operations, each program has an umask for
lowering the maximum permissible rights for example - 002
It is necessary not to forget that all files created under the root are unavailable to the rest, therefore you need to change the permissions
before going out on them
Change privileges to all files in the current folder: find ./ -type f -exec chmod 777 {} \;
Change privileges to all folders in the current folder: find ./-type d -exec chmod 777 {} \;
create an empty file in the current folder: > name.file
send the contents of the file to the mail (for easy viewing): mail -s "hello" my mail@mail.ru <
/etc/php7.0/file
Also important are the commands of static and dynamic mount, format, check drives.
With mounting everything is simple. Suppose you need to connect a new hard drive for storing backup copies or a flash drive - a USB flash drive or CDRoom.
If you used to use Windows, then you are most likely accustomed to the disks with the names (C :) , (D :) , etc.
On Ubuntu Linux, things are different. If in Windows for each partition of a hard drive, CD drive, flash drive or card reader, a specific letter was assigned, for example (E :) , then on Linux the contents of all the mounted and internal drives are displayed as folders that are mounted (connected) to the root of the file system (/)
In Linux, connecting a disk to the main file system is called mounting .
A list of all mounted devices can be found with the mount command.
To perform a manual mount (for example, an internal new hard drive), you can do the following:
1. find out what kind of partitions and disks you have physically
We learn the names of sections. cat / proc / partitions or blkid
sdb sda are physical numbers disks - these are sections
2. create an empty folder through which access to this section will be (this will be the mount), assign it the necessary access rights
3. mount for example sudo mount / dev / sdb5 / folder_for_disk2 (mount via device names)
Suppose we do not know which file system is on disk. Fortunately, in most cases, it is possible to rely on the automatic detection of the system.
  $ sudo mount / dev / md0 / mnt / raid0 -t auto -o rw, nls = utf8, noatime

 $ mount
 ....
 / dev / md0 on / mnt / raid0 type ext3 (rw, noatime, nls = utf8)
4. if permanent automatic mounting is needed, then make the appropriate changes to the / etc / fstab file; such mounting is called -mounting via a universally unique identifier (UUID).
  4.1 Recognize the UUID of partitions for this sudo blkid
  Create directories for mounting:
  4.2 sudo mkdir / mnt / Shared / mnt / Tr5775Net8Gb
  4.3 On behalf of the administrator, open the / etc / fstab file, which contains information about all partitions mounted at boot: sudo nano / etc / fstab
  4.4 Add to the end of the file,
  for NTFS:
UUID = "77A62DEF5CCCCC7C" / mnt / Shared ntfs rw, nls = utf8, gid = plugdev, umask = 0002 0 0
for FAT and FAT32:
UUID = "3E3B-F557" / mnt / TrendNet8Gb vfat rw, exec, codepage = 866, nls = utf8, gid = plugdev, umask = 0002, nofail, users 0 0
4.5 Mount the newly inscribed disk partitions:
sudo mount -a
4.5. unmounting
umount |
Thus, to unmount our new partition, we can enter:
$ umount / mnt |
or:
$ umount / dev / hdb1 |
crown mount example
@reboot mount / dev / sdb5 / disk2
4.6.Adjustment system
Now the disks began to connect automatically, but since this is done as root, we have lost the ability to share the rights on the connected disks, in order to restore this possibility we will add the configuration in Samba:
sudo gedit /etc/samba/smb.conf
add to the [global] section:
usershare owner only = false
4.7.automatting of the above devices
At the moment, Ubuntu Linux performs automatic mounting of all detected connected devices (external hard drives, flash drives, cameras, etc.) to the root of the file system in the / media / directory. For example, if you insert a flash drive with the label “Flash_card” , the system will mount it into the / media / Flash_card directory . In any case, you do not need to think where and how to mount external media, because they automatically become available on the desktop panel in the Transition menu.
When creating a user :
useradd userlogin
and when using the usermod -p command, the password should be encrypted,
therefore, it is better to set and change the password through
passwd userlogin
When creating a user for FTP (PROFTPD) it is necessary
in the ftp /etc/proftpd/proftpd.conf config
Order deny, allow
AllowUser ftplogin
AllowUser userftplogin
and user add shell to usermod Shell: / bin / sh, but disable terminal in usermod
An example of all the actions for creating a ftp-user from the command line
useradd userftplogin
passwd userftplogin
usermod -g www-data userftplogin (primary, main group)
usermod -G www-data userftplogin (additional groups)
usermod -d / var / www / siteuser / userftplogin
That's all. Try to log in, if there are samples, then check everything, SP, password, port and user data.
View the main getent group userftplogin group
View all groups groups userftplogin
Subtleties. for the user there can be only one main group and many additional ones.
Create and add user to group
useradd -G www-data ftplogin
useradd -G sudo userlogin
change user with adding to root group
usermod -aG sudo login
Make a super user without editing the sudoes file:
gpasswd -a login sudo
Change home directory
usermod -d / home / homediruser / username
user information:
finger userlogin (you first need to install)
edit cron: crontab -e cron for each user, except when from the root
in the crontab there should be an empty line at the end
Download the resource from the Internet in the current folder: wget
send request by any method: curl
add apache module: a2enmod headers do not manually climb into the config for this
add php module: php5enmod gd (php5enmod mcrypt) do not manually crawl into the config for this
do not manually change the sudo config only through the utility otherwise access to sudo will be lost
For ftp and muskl servers - disable ip6, resolve ip, enable and forward passive ports.
for a muscle, you need to start and check that it is running () process 1 for events.
mail server - DKIM setup
php_value upload_max_filesize 50M
php_value post_max_size 50M, etc.
see and change the time: date
synchronize time with atomic clocks
  ntpdate -s ntp.ubuntu.com
  or install self-synchronization utility
  apt-get install ntp


  php settings can be in the main config in the /ets/php/7.0/php.ini folder
  or in user.ini in the root of the directory - it depends on the settings (if the global config is used by that and pkhp as an apache module) then you can override the settings of php from the apache configuration file.
  if php is configured as fpm, then php settings are possible only from php configs

  Configurations for each domain (host) can be divided into separate files

  /etc/apache2/sites-enabled/host1.com.cfg


  approximately with such content (if nginx as a proxy for static content)
ServerAdmin decode@mail.ru
ServerName host1.com
DocumentRoot /var/www/host1.com/public_html/
ServerAlias host1.com
Options -MultiViews
AllowOverride All
ErrorLog /var/www/host1.com/logs/error.log
# Possible values include: debug, info, notice, warn, error, crit,
# alert, emerg.
LogLevel info
CustomLog /var/www/host1.com/logs/access.log combined
  after configuration changes you need to re-test configs
  using the apachectl configtest command and only then restart


  for nginx, the settings are in the files:
/etc/nginx/sites-enabled/host1.com.nginx.conf
upstream stream1 {
# Address back-end'a
server localhost: 8282;
}
server {
listen 80;
server_name host1.com www.host1.com;
access_log /var/www/host1.com/logs/nginx_access.log;
error_log /var/www/host1.com/logs/nginx_error.log;
....
# rewrite ^ https: //host1.com$request_uri? permanent ;.
# Redirect to back-end
location / {
proxy_pass http: // stream1;
include / etc / nginx / proxy_params;
}
client_max_body_size 300m;
client_body_buffer_size 128k;
proxy_connect_timeout 75s;
proxy_send_timeout 360s;
proxy_read_timeout 1200s;
# Static filling gives nginx itself
location ~ * \. (css | ico | swf | js | jpeg | jpg | bmp | gif) $ {
root /var/www/host1.com/public_html/public;
access_log off;
}
}
  looking for configuration changes, you also need to retest it with the command
  service nginx configtext
  and only after that restart and check that the settings are in effect and the sites on the server are working


  If on the server there are several ip's then needed in the configs
  nginx or apache (depending on what the external 80th or 443 port is listening on)

  have separate sections not only for hosts but also for ip

  listen ip.ip.ip.ip1: 80
  {
  ....
  }


  and in the second
  listen ip.ip.ip.ip2: 80
  {
  }


  if php is set as fpm, user settings can be in the root of the domain and have approximately the following contents
;;;;;;;;;;;;;;;;;;;;
; Resource Limits;
max_execution_time = 300
max_input_time = 600
; max_input_nesting_level = 64
max_input_vars = 100000
memory_limit = 128M
;;;;;;;;;;;;;;;;;;;;;;;;;;;;;;;
; Error handling and logging;
;;;;;;;;;;;;;;;;;;;;;;;;;;;;;;;
error_reporting = E_ALL
display_errors = On
display_startup_errors = Off
log_errors = On
log_errors_max_len = 1024
;;;;;;;;;;;;;;;;;
; File Uploads;
;;;;;;;;;;;;;;;;;
file_uploads = On
; upload_tmp_dir =
upload_max_filesize = 12M
max_file_uploads = 20
post_max_size = 12M
;;;;;;;;;;;;;;;;;;;
; Fopen wrappers;
;;;;;;;;;;;;;;;;;;;
default_socket_timeout = 60
in the .user.ini file
In this case, you must first allow the support of such files in the settings of the main php.ini config, its name
and the re-read time (as it is the default cache for min 10)
and only after that you can restart php
service php7-fpm restart
1. update the index and the packages themselves apt-get update + sudo apt-get upgrade
2. update the do-release-upgrade system, it’s dangerous, therefore, before that, it’s better to backup everything
Total.
3. installing without compiling apt-get install new package
4. remove apt-get remove package name
If it cannot be updated or installed, the package may have been corrupted during the previous installation,
You can try the forced installation.
if it cannot connect to repositories, try adding a backup DNS 8.8.8.8 in the apt config.
setting
apt-get install clamav
approximate setting in the crown
00 1 * * * freshclam --quiet -l /var/logs/clam-update.log
10 1 * * * clamscan --move = / etc / clamav / virus_found -r / var / www -i> /var/www/antivirus.log &&
mail -s "antivirus daily" ---@mail.ru 30 3 * * * mail -s "Result Scan $ (date)" ---@mail.ru
update logs /var/www/clam-update.log
check logs /var/www/antivirus.log
infected files are moved to the special folder / virus_found, the folder must be created in advance and have sufficient rights
the most important thing is not to reboot once again, especially the database server because he can destroy the base.
at the very least, stop Apache first so that there is no connection to the database, and then try with it
do something.
everything else can be freely rebooted, but after a reboot, new errors may appear
therefore, it is better to first eliminate the cause of their occurrence.
Notes
=========================
resize tmp (tmpfs) on the fly
See how much space we have now:
$ df -h / tmp
Filesystem Size Used Avail Use% Mounted on
tmpfs 1000M 64K 999M 1% / tmp
Resize as follows:
# mount -o remount, size = 2G / tmp
Now it's better:
df -h / tmp
Filesystem Size Used Avail Use% Mounted on
tmpfs 2.0G 64K 2.0G 1% / tmp
motivit in two ways
or instantly on-line, online
or logging and then look at the logs for a large time interval of the day, week, month
First, we will consider logging based on logs and previously collected information.
You can install various utilities to collect and analyze server load by different parameters.
(de so you can write such scripts yourself)
examples of parameters that can be monitored
9.1 server load report is calculated via the system command
uptime or /proc/loadavg
example load average: 0.09, 0.05, 0.01
in php its values can be obtained array sys_getloadavg (void)
then we record at regular intervals in the database. for example once a minute or 5 minutes
and build a graph
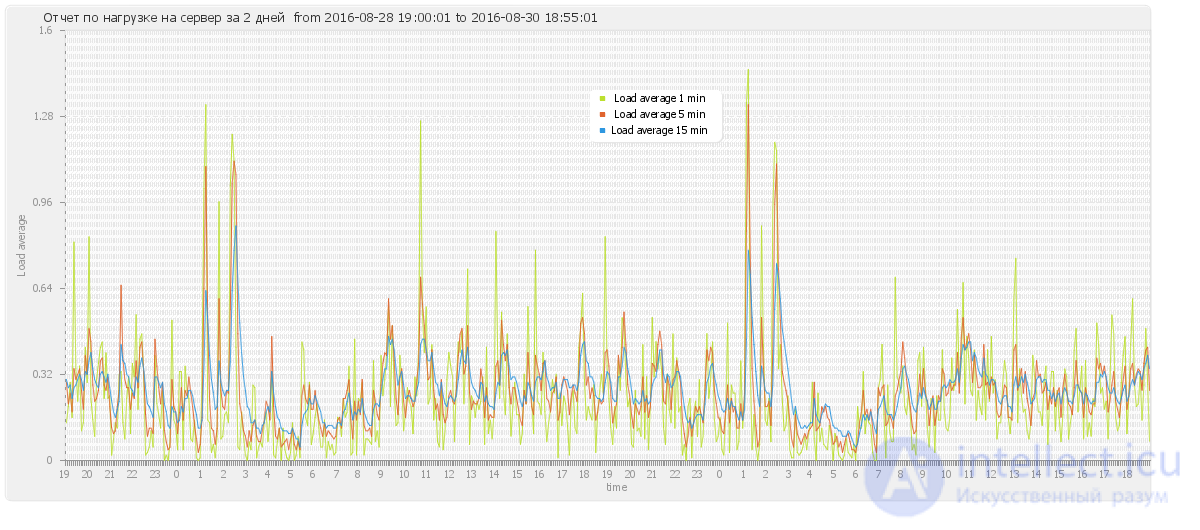
If the load on your system exceeds 1.00 in a one-minute interval, everything is fine. If the load exceeds 1.00 in the five or 15-minute interval, you should start taking action (of course, you should also take into account the number of cores in your system).
The cat /proc/cpuinfo displays information about all the processors on your system. To find out the number of cores, feed its output to the grep utility:
 ~$ cat /proc/cpuinfo | grep 'cpu cores' cpu cores : 8 cpu cores : 8 cpu cores : 8 cpu cores : 8


  .  Having two processors (cores), it is possible (theoretically) to simultaneously run twice as many programs.  This means that an average load of 2.00 (on a dual-processor computer) will be equivalent to an average load of 1.00 (on a single-processor computer).

  if you have 4 cores then for you load average with a value of 3-4 will be primelyemy
  On multi-core processors, the LA value is related to the number of processors.  Usage is 100% displayed as 1.00 on a single-core system, 2.00 on a dual-core, 4.00 on four, and so on.
  A single core processor is similar to a single lane road.  Imagine that you control the movement of cars on the bridge.  Sometimes, your bridge is loaded so hard that cars have to wait in line to drive through it.  You want to let people know how long they will have to wait to move to the other side of the river.  A good way to do this would be to show how many cars are waiting in the queue at a particular point in time .  If there are no cars in the queue, driving drivers will know that they will be able to immediately cross the bridge.  Otherwise, they will understand that they will have to wait for their turn.
  So, Bridge Manager, which notation will you use?  How about this:
 load average = 1.00
 load average = 0.50
 load average = 1.70
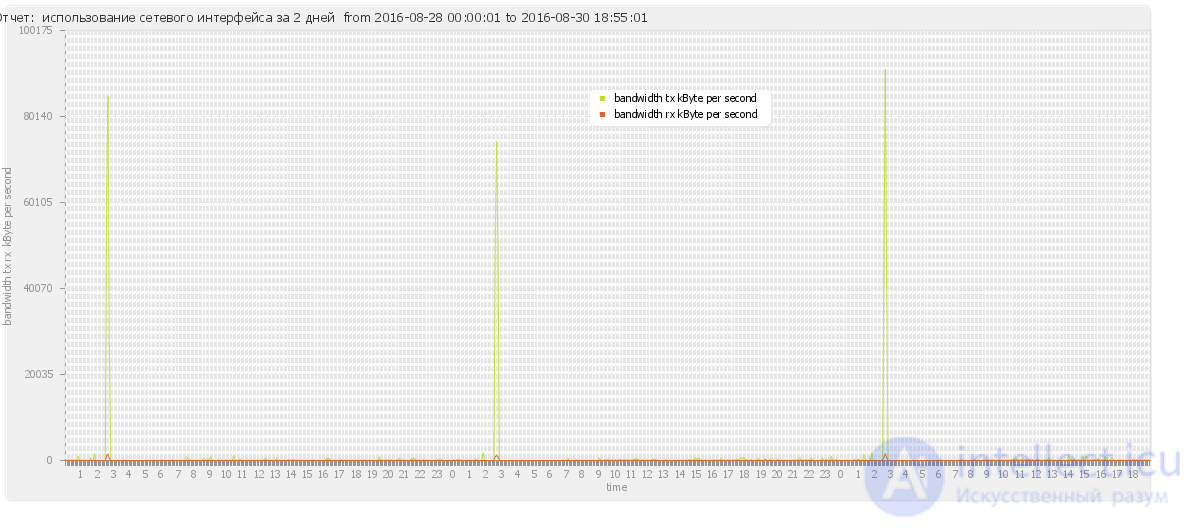
  If you go back to our bridge analogy, 1.00 means "one fully loaded lane."  If there is only one lane on the bridge, 1.00 means that the bridge is 100% loaded, but if there are two lanes, it is only 50% loaded.
  The same with processors.  1.00 means 100% single-core processor utilization.  2.00 - 100% dual-core loading, etc.

  9.2 use of the network interface
  it is possible to embroider by the meter of the network adapter (interface)
for example when performing
  ifconfig eth0 (eth0 is the name of your interface)
  get a set of information among which there are counters of transmitted and received bytes
  RX bytes: 25457904 (24.2 Mb) TX bytes: 6540945 (6.2 Mb)
  in order to determine the load.  make measurements at specific intervals and divide
  their differences on each other multiplying by 8
  (to translate into bits)
  in the end there will be such a picture
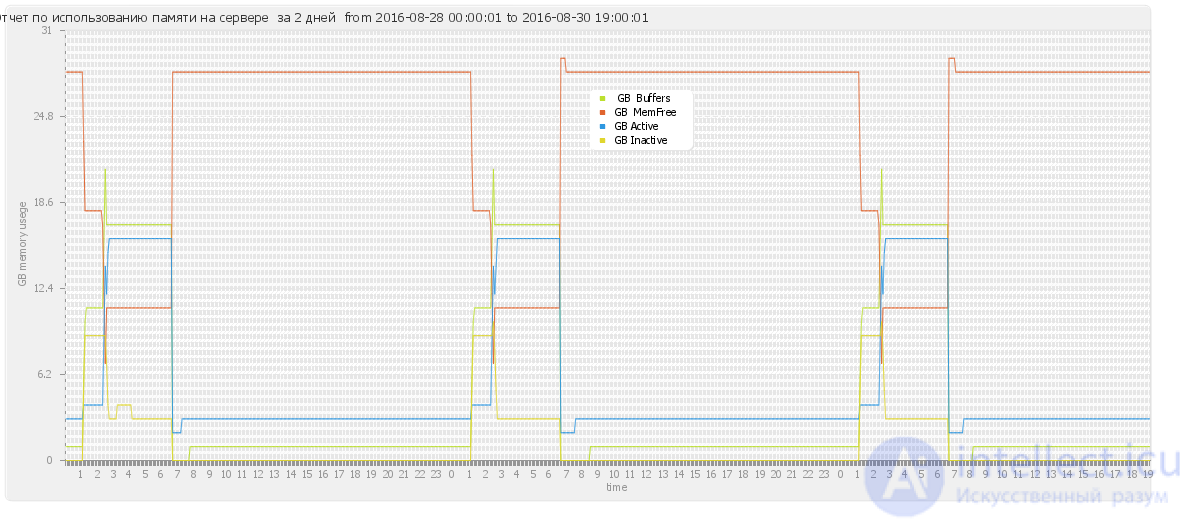
9.3 memory usage report
 free -m
  or
  vmstat -s
  9.4 report from server ping from another server
  9.5 report on Apache logs, for cov requests, response codes, transmitted byte count

  9.6 viewing system loads in real time

 Для просмотра запущенных процессов в Ubuntu Linux при помощи терминала, необходимо набрать в нем следующие команды:
 Программа top динамически выдает в режиме реального времени информации о работающей системе, показывает запущенные процессы и потребление ими ресурсов системы. По умолчанию выдает задачи, наиболее загружающие процессор сервера, и обновляет список каждые пять секунд.
 При выполнении top в верхней части окна отображается астрономическое время, время, прошедшее с момента запуска системы, число пользователей в системе, число запущенных процессов и число процессов, находящихся в разных состояниях, данные об использовании ЦПУ, памяти и свопа.
 Далее идет таблица, характеризующая отдельные процессы. Число строк, отображаемых в этой таблице, определяется размером окна: сколько строк помещается, столько и выводится. Список процессов может быть отсортирован по используемому времени ЦПУ (по умолчанию), по использованию памяти, по PID, по времени исполнения. Переключать режимы отображения можно с помощью команд, которые программа top воспринимает. Это следующие команды (просто нажимайте соответствующие клавиши, только с учетом регистра, то есть вместе с клавишей Shift):
 Shift+N — сортировка по PID;
 Shift+A — сортировать процессы по возрасту;
 Shift+P — сортировать процессы по использованию ЦПУ;
 Shift+M — сортировать процессы по использованию памяти;
 Shift+T — сортировка по времени выполнения.
 Кроме команд, определяющих режим сортировки, команда top воспринимает еще ряд команд, которые позволяют управлять процессами в интерактивном режиме. С помощью команды можно завершить некоторый процесс (его PID будет запрошен), а с помощью команды можно переопределить значение nice для некоторого процесса. Таким образом, эти две команды аналогичны командам kill и renice .
 Команду том можно использовать со следующими параметрами:
 t – Включение и выключение выдачи на экран суммарных данных.
 m – Включение и выключение выдачи на экран информации об использовании памяти.
 A- Sort rows by the maximum consumption of various system resources. Useful for quick identification of tasks for which the system lacks resources.
 f - Enter the interactive configuration menu for data displayed on the screen with the top command. Useful for setting the top command to perform a specific task.
 o - Allows you to interactively set the order of the lines issued by the top command.
 r - Change the priority of processes using the renice command.
 k - Deleting a process using the kill command.
 z - Switch between color / monochrome image output.
Команда ps выдаст краткий список текущих процессов. Вывод команды ps схож с выводом команды top , однако он отображает статический снимок процессов. Для того, чтобы выбрать все процессы, используете параметр - A или - e
ps -Al
Для того, чтобы включить выдачу всех данных (будут показаны аргументы командной строки, переданные в процесс):
ps -AlF
 ps ax
 ps axu
ps -AlFH
 ps -eo euser,ruser,suser,fuser,f,comm,label
 ps axZ
 ps -eM
 ps -ejH
 ps axjf
 pstree
ps -AlLm
Позволяет выводить данные в последовательности, определяемой пользователем
 ps -eo pid,tid,class,rtprio,ni,pri,psr,pcpu,stat,wchan:14,comm
 ps axo stat,euid,ruid,tty,tpgid,sess,pgrp,ppid,pid,pcpu,comm
 ps -eopid,tt,user,fname,tmout,f,wchan
ps -U User -u User u
ps -C apache -o pid=
or
pgrep apache
ps -p 30470 -o comm=
ps -auxf | sort -nr -k 4 | head -10
ps -auxf | sort -nr -k 3 | head -10
 По умолчанию, команда ps выводит только информацию о процессах, запущенных в текущей сессии терминала bash. Для вывода информации по всем процессам необходимо ввести команду ps с параметром -е .
 Для отображения желаемых полей необходимо ввести команду ps с параметром -о поле1,поле2,…, где через запятую перечисляются поля, которые необходимо отобразить.
Команда free показывает общее количество свободной и используемой системой физической памяти и памяти свопинга, а также размеры буферов, используемые ядром.
free
Команду uptime можно использовать с тем, чтобы определить, как долго работает сервер. Выдаются: текущее время, сколько времени работает система, сколько в текущий момент зарегистрировано пользователей и какова средняя нагрузка на систему в последние 1, 5 и 15 минут.
uptime
Команда w выдает информацию о том, какие пользователи сейчас находятся в системе и какие процессы запущены от их имени.
 w username
 w User
Команда pmap выдает данные о распределении памяти между процессами. Использование этой команды позволит найти причину узких мест, связанных с использованием памяти.
pmap -d PID
Для того, чтобы получить информацию об использовании памяти процессом с pid # 26321, введите:
pmap -d 26321
Команда vmstat выдает информационный отчет об активности процессов, памяти, свопинга, поблочного ввода/вывода, прерываний и процессора.
vmstat 3
vmstat -m
vmstat –a
ссылка на эту статью обязательна (с) intellect
Команда mpstat выводит данные об активности каждого имеющегося в наличие процессора, процессор 0 будет первым. Команда mpstat -P ALL выводит данные о среднем использовании ресурсов для каждого из процессоров:
mpstat -P ALL
Команда iostat выдает статистику использования процессора, а также статистику ввода/вывода для устройств, разделов и сетевых файловых систем (NFS).
iostat
Команда sar используется для сбора информации о системной активности и выдачи ее в виде отчета или ее сохранения. Чтобы увидеть значение считчика сетевой активности, введите:
sar -n DEV | more
Для того, чтобы увидеть значения счетчиков сетевой активности, начиная с 24-го:
sar -n DEV -f /var/log/sa/sa24 | more
С помощью команды sar Вы можете также получать данные в режиме реального времени:
sar 4 5
 который выдает столько же данных, как вместе взятые vmstat, iostat, ifstat и netstat,
 В Ubuntu не установлена. Для установки наберите в терминале:
sudo apt-get install dstat
- средство мониторинга, предназначенное для использования в X Window. Оно хорошо конфигурируемое и позволяет следить за многими системными переменными, в том числе состоянием процессора, памяти, пространства свопинга, дисковыми носителями, температурой, процессами, сетевыми интерфейсами, зарядом батареи, системными сообщениями, поступающими письмами и т.д.
- используется для мониторинга состояния процессоров, оперативной памяти, жестких дисков, сетевыми интерфейсами, локальными и удаленными почтовыми ящиками и многими другими вещами.
- улучшенная версия интерактивного просмотрщика процессов top. htop позволяет просматривать процессы в виде дерева процессов.
| Архивирование и сжатие файлов | |
| bunzip2 file1.bz2 | разжимает файл 'file1.gz' |
| gunzip file1.gz | |
| gzip file1 | сжимает файл 'file1' |
| bzip2 file1 | |
| gzip -9 file1 | сжать файл file1 с максимальным сжатием |
| rar a file1.rar test_file | создать rar-архив 'file1.rar' и включить в него файл test_file |
| rar a file1.rar file1 file2 dir1 | создать rar-архив 'file1.rar' и включить в него file1, file2 и dir1 |
| rar x file1.rar | распаковать rar-архив |
| unrar x file1.rar | |
| tar -cvf archive.tar file1 | создать tar-архив archive.tar, содержащий файл file1 |
| tar -cvf archive.tar file1 file2 dir1 | создать tar-архив archive.tar, содержащий файл file1, file2 и dir1 |
| tar -tf archive.tar | показать содержимое архива |
| tar -xvf archive.tar | распаковать архив |
| tar -xvf archive.tar -C /tmp | распаковать архив в /tmp |
| tar -cvfj archive.tar.bz2 dir1 | создать архив и сжать его с помощью bzip2 (Прим.переводчика. ключ -j работает не во всех *nix системах) |
| tar -xvfj archive.tar.bz2 | разжать архив и распаковать его (Прим.переводчика. ключ -j работает не во всех *nix системах) |
| tar -cvfz archive.tar.gz dir1 | создать архив и сжать его с помощью gzip |
| tar -xvfz archive.tar.gz | разжать архив и распаковать его |
| zip file1.zip file1 | создать сжатый zip-архив |
| zip -r file1.zip file1 file2 dir1 | создать сжатый zip-архив и со включением в него нескольких файлов и/или директорий |
| unzip file1.zip | разжать и распаковать zip-архив |
можно выполнить на основе анализа системного журнала или после установки специальных утилит
Получить информацию о системе можно с помощью команды uname , которая пишет в стандартный вывод имя используемой операционной системы. Если указать одну из описанных ниже опций, на консоль будет выведена более специализированная информация о характеристиках системы:
# uname -a

Linux Host Address 4.4.0-36-generic # 55-Ubuntu SMP Thu Aug 11 18:01:55 UTC 2016 x86_64 x86_64 x86_64 GNU / Linux
 # cat / etc / issue
Ubuntu 16.04.1 LTS \ n \ l
There is another way to view distribution information:
# lsb_release -a
No LSB modules are available.
Distributor ID: Ubuntu
Description: Ubuntu 16.04.1 LTS
Release: 16.04
Codename: xenial
создайте файл с правами на запуск и запустите его
echo "System: "`lsb_release -d --short` `uname -m` >
продолжение следует...
Часть 1 Support and daily use of LAMP Linux (Ubunutu), problem solving due to errors, system monitoring
Часть 2 - Support and daily use of LAMP Linux (Ubunutu), problem

Comments
To leave a comment
Running server side scripts using PHP as an example (LAMP)
Terms: Running server side scripts using PHP as an example (LAMP)