Lecture
The main idea of the hierarchy analysis method (MAI) by Saaty [13, 14] is that the research problem is decomposed into separate parts and presented as a hierarchy. When this occurs, the structuring and simplification of the problem. The hierarchy contains a goal at the top level, sub-goals and criteria at the lower levels. The result of the work of the method are the values of a multidimensional function built for a given hierarchy. The values of this function for objects allow you to compare them in the sense of achieving the goal.
The method consists of the following steps:
1. the formation of a hierarchy;
2. obtaining estimates of objects, weight coefficients of criteria and sub-goals for all levels of the hierarchy;
3. evaluation of the homogeneity of expert judgments;
4. calculation of integral object estimates.
Hierarchy Formation
Building a hierarchy begins with a delineation of the research problem. Next, the hierarchy itself is constructed, including the target located at its top, intermediate levels containing sub-goals and, possibly, criteria, as well as objects forming the lowest hierarchical level (Fig. 4.2). Levels can be any number.

Fig. 4.2. 4-level hierarchy example
Obtaining estimates of objects, weighting criteria criteria
and sub goals
To formalize expert knowledge of the comparative importance of hierarchical elements located at one level relative to the overlying hierarchy element, a special 9-point scale proposed by the author of the method is used.
(table 4.2).
The eligibility of this scale is proved theoretically when compared with many other scales [13, p. thirty]. When using the specified scale, the decision maker (DM), comparing the two hierarchy elements in the sense of their contribution to the achievement of a sub-goal or goal located at the higher level of the hierarchy, should associate this comparison with a number in the range from 1 to 9 or the opposite value of numbers . In cases where it is difficult to distinguish between so many intermediate gradations from absolute to weak preference or this is not required in a specific task, a scale with fewer gradations can be used. In the limit, the scale has two estimates: 1 - the elements are equivalent; 2 - preference of one element over another.
Table 4.2
Scale for paired comparison of sub-goals, criteria and objects
Degree of significance | Definition | Explanation |
one | Equal significance | Two actions contribute equally to goal achievement. |
3 | Some predominance of the significance of one action over another (weak significance) | There are considerations in favor of preference for one of the actions, but these considerations are not sufficiently convincing |
five | Significant or strong significance | There are reliable data or logical judgments in order to show the preference of one of the actions. |
7 | Obvious or very strong significance | Convincing evidence in favor of one action before another |
9 | Absolute significance | Evidence in favor of preference of one action to another is highly convincing. |
2,4,6,8 | Intermediate values between two adjacent judgments | The situation when you need a compromise solution |
Reciprocals of the above nonzero values | If action i when comparing with the action j, one of the non-zero numbers defined above is attributed, then the opposite is attributed to the action j when comparing with the action i | If consistency has been postulated upon receipt of numeric values to form a matrix |
On the basis of this scale, the decision makers are asked to compare objects in pairs by some criterion. The result of pairwise comparisons are entered into the matrix of pairwise comparisons. An example of comparing objects on a scale is presented in Table. 4.3.
Table 4.3
An example of comparing objects on a scale
Object number | one | 2 | ... | n |
one | one | k 1 / k 2 | ... | k 1 / k n |
2 | k 2 / k 1 | one | ... | k 2 / k n |
... | ... | ... | ... | ... |
n | k n / k 1 | k n / k 2 | ... | one |
where the ratio k i / k j - expresses an expert opinion on how many times object i is better (worse) than object j .
To obtain specific estimates of objects for this criterion, there are two main approaches: the first is the calculation of the eigenvector of the matrix of pairwise comparisons, the second is the calculation of the row sums of the matrix of pairwise comparisons, and then the rationing of the obtained values. The sum of the weighting factors of the sub-goals or criteria of one level of hierarchy is equal to 1.
Obtaining weighting coefficients of criteria and subgoals is similar.
Assessment of expert judgment homogeneity
When an expert completes a pair-wise comparison matrix, errors can be made that violate the quantitative or transitive homogeneity of judgments, since human judgments cannot be expressed by an exact formula. Therefore, to improve the homogeneity, the elements located below the main diagonal are inverse values to the corresponding elements lying above the main diagonal.
If the homogeneity is violated, the rank of the matrix of pairwise comparisons is different from unity, and it will have several eigenvalues. With small deviations of judgments from homogeneity, one of the eigenvalues will be significantly larger than the others and approximately equal to the order of the matrix. Therefore, to assess the homogeneity of expert judgments, it is necessary to use the deviation of the maximum eigenvalue value λ max from the matrix order n [13, p. 35].
The homogeneity of judgments is estimated by the homogeneity index of the OI or the OO homogeneity relation:
IO = ( λ max - n ) / ( n -1 ), (4.1)
OO = OO / M (OO), (4.2)
where M (IO) is the average value (mathematical expectation) of the homogeneity index of a randomly composed pairwise comparison matrix [ W ], which is based on experimental data (Table 4.4) [13, p. 36].
Table 4.4
The average value of the homogeneity index depending on the order of the matrix
Matrix order n | M (IO) | Matrix order n | M (IO) | Matrix order n | M (IO) |
one | 0.00 | 6 | 1.24 | eleven | 1.51 |
2 | 0.00 | 7 | 1.32 | 12 | 1.48 |
3 | 0.58 | eight | 1.41 | 13 | 1.56 |
four | 0.90 | 9 | 1.45 | 14 | 1.57 |
five | 1.12 | ten | 1.49 | 15 | 1.59 |
As a valid value, the OO value is not more than 0.1. If, for the matrix of pairwise comparisons, the ratio of homogeneity of OO is greater than 0.1, then this indicates a significant violation of the logical judgment of the expert. Therefore, the expert is invited to revise the data used to construct the matrix.
Homogeneity is assessed for all pairwise comparison matrices.
Calculation of integral object estimates
Thus, at the previous step weighted coefficients for all elements of the hierarchy were obtained. The integral evaluation of an object is defined as a weighted sum of the values of sub-goals (criteria) of the second level, which in turn are calculated as weighted sums of values of the criteria of the third level and so on until the values of the criteria of the lower level of the hierarchy are obtained.
Remark To obtain the weighting factors of the criteria and sub-goals of the hierarchy, several experts can be involved, each of whom fills in matrices of pairwise comparisons. In this case, as a weight coefficient for the hierarchy element corresponding to a certain vertex, we consider the geometric average of weighting coefficients obtained using the matrix of pairwise comparisons for each of the experts:
 ,
,
where Q is the number of experts.
An example of building a rating of computer companies based on the MAI Saaty
As an example, a small dimension task was chosen in order to visually show all stages of the method implementation.
1. Formation of hierarchy (Fig. 4.3).
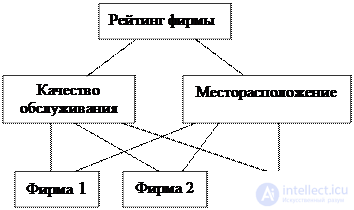
Fig. 4.3. Hierarchy for determining company rating
2. Obtaining estimates of objects, weight coefficients of criteria and sub-goals.
To obtain the weights of the criteria, the expert is invited to evaluate the “importance” of the criteria on a 9-point scale. The results of the comparison are recorded in the table. 4.4.
Table 4.4
The results of the comparison of criteria by an expert
Criterion name | Quality of service | Location |
Quality of service | one | 3/1 |
Location | 1/3 | one |
According to the scale proposed by Saati, the value “3/1” means that, according to the expert, the criterion “quality of service” (KO) slightly exceeds in importance the criterion “location of the company” (MF). The calculation of the weighting coefficients of the importance of the criteria with the help of row sums is presented in Table. 4.5.
Table 4.5
Weighting coefficients using line sums
Criterion | KO | Mf | Line amount | Normalized weight value | Weight designation |
KO | one | 3/1 | four | 4 / 5.33 = 0.75 | w 1 |
Mf | 1/3 | one | 1.33 | 1.33 / 5.33 = 0.25 | w 2 |
Amount | 5.33 | one | |||
The values of the criteria for firms are calculated similarly. The results of the comparisons as well as the values of the criteria are given in
tab. 4.6 and 4.7.
Table 4.6
Comparison of firms on the criterion of "quality of service"
Company number | one | 2 | 3 | Line amount | Normalized criterion value | Criterion Meaning |
one | one | 7/1 | 3/1 | eleven | 0.59 | k 11 |
2 | 1/7 | one | 1/5 | 1.34 | 0.07 | k 12 |
3 | 1/3 | 5/1 | one | 6.33 | 0.34 | k 13 |
Amount | 18.67 | one | ||||
Table 4.7
Comparison of firms on the criterion of "location"
Company number | one | 2 | 3 | Line amount | Normalized criterion value | Criterion Meaning |
one | one | 1/5 | 1/7 | 1.48 | 0.07 | k 21 |
2 | 5/1 | one | 1/3 | 6.33 | 0.34 | k 22 |
3 | 7/1 | 3/1 | one | eleven | 0.59 | k 23 |
Amount | 18.81 | one | ||||
The weighting coefficients for the importance of criteria and the values of the criteria of firms can also be calculated as the eigenvectors of the matrix of pairwise comparisons.
3. Evaluation of hierarchy homogeneity.
For each of the matrix of pairwise comparisons, we calculate the homogeneity index and the homogeneity relation using formulas (4.1) and (4.2). The results are presented in table. 4.8.
Table 4.8
Homogeneity Index Values for Pair Comparison Matrices
Pair Comparison Matrix | Homogeneity ratio |
weights | 0.00 |
firms by criterion KO | 0.05 |
firms by criterion mf | 0.05 |
4. The calculation of the integral estimates is given in table. 4.9.
Table 4.9
Calculation of integral estimates
Company number | Formula | Value | Company rating |
one | w 1 * k 11 + w 2 * k 21 | 0.75 * 0.59 + 0.25 * 0.07 = 0.459 | one |
2 | w 1 * k 12 + w 2 * k 22 | 0.75 * 0.07 + 0.25 * 0.34 = 0.138 | 3 |
3 | w 1 * k 13 + w 2 * k 23 | 0.75 * 0.34 + 0.25 * 0.59 = 0.401 | 2 |

Comments
To leave a comment
Decision theory
Terms: Decision theory