Statistic (mean, mode, variance, standard deviation, median, sum, range) for numbers separated by commas or line breaks
An online service for obtaining statistical data for a given set of numbers is a powerful data analysis tool that allows users to quickly and conveniently calculate various statistics for a given set of numbers. Here are the main characteristics and functions of this service:
Description of functionality:
Mode: The service calculates the mode, that is, the value or values that occur most frequently in a given array of numbers.
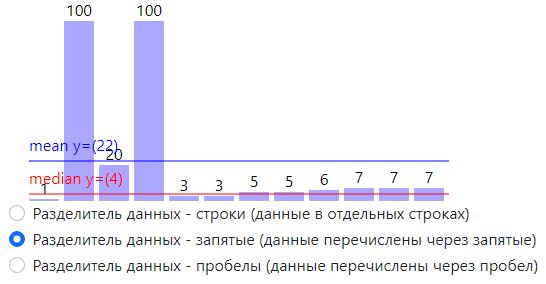
Median: Calculate the median - the average value that divides an ordered array of numbers into two equal parts. This is a measure of central tendency.
Arithmetic mean: Calculate the arithmetic mean of the entire array of numbers.
Geometric Mean: Calculates the geometric mean, which is especially useful when working with percentage changes and geometric series.
Standard Deviation (Root Mean Square Deviation): An estimate of the spread of data in an array. Standard deviation measures how much the values differ from the mean.
Variance: Calculate variance, which is a measure of the spread of data. This value is calculated as the standard deviation squared.
Sum: Calculate the sum of all numbers in a given array.
Largest: Determines the largest number in the array.
Smallest: Determines the smallest number in the array.
Range: Calculate the range of the data, that is, the difference between the largest and smallest number in the array.
Interface:
The service has a simple and intuitive interface. The user can enter their array of numbers into the provided input field. After entering data, the user selects the necessary statistics to calculate, and the service provides the results in a convenient format, such as a table or graph.
Additional functions:
Ability to save analysis results in a file or share them with other users.
Supports various data formats, including floating point and negative numbers.
Graphical representation of data, including histograms, scatter plots, and other visualizations.
Automatic detection of outliers and anomalies in data.
This online service facilitates data analysis and allows users to quickly obtain important
information about the distribution of numbers in their data sets, which is useful in
a variety of fields including statistics, scientific research, finance and many others.